
Match the format to the amount of data, not to the patient. Research comparing four ways of presenting clinical test results found that plain tables sufficed for simple result sets while trend visualizations performed better for complex long-term data. One baseline reading fits in a sentence. Eight weeks across six sites needs a picture.
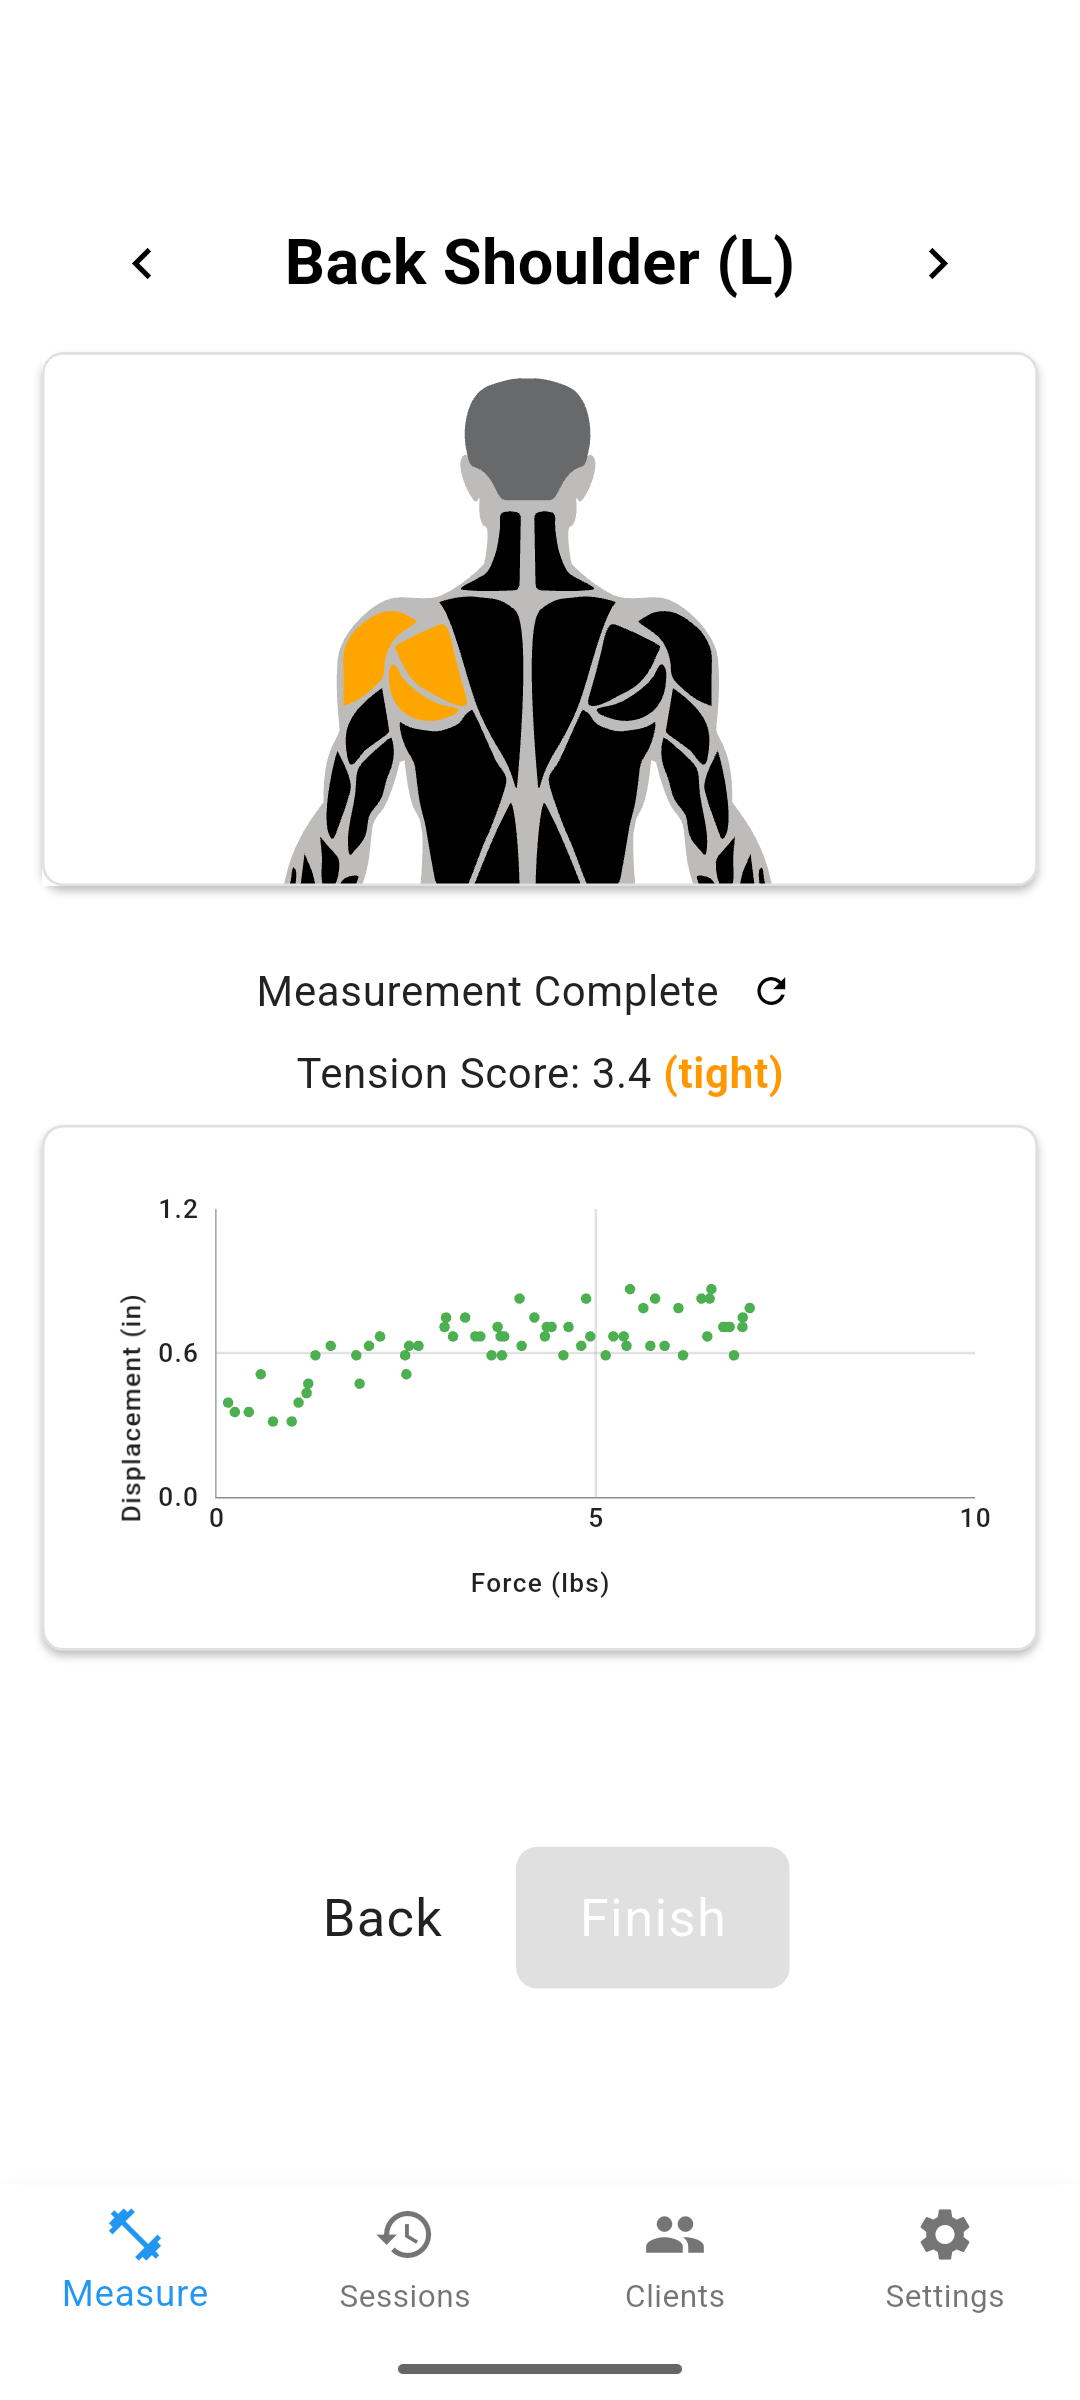
Does presentation format actually change what a patient concludes?
Yes, and the effect is measurable. Torsvik, Lillebo, and Mikkelsen, publishing in the Journal of the American Medical Informatics Association in 2013, ran a balanced crossover experiment in which participants reviewed the same clinical chemistry results using four different visualization techniques.
Assessments differed by format. Sparklines and relative multigraphs produced faster judgments. Relative multigraphs surfaced more covarying results. Absolute multigraphs surfaced more trends. With sparklines, participants more often judged results to be within reference ranges. The conclusion was that presentation influenced interpretation, and that no technique was ideal in every setting.
The transfer to a chiropractic re-examination is direct. The stiffness reading is fixed. What the patient takes away from it is not.
What makes a raw stiffness number useless to a patient?
The absence of a reference point. A reading in newtons per meter carries no meaning for someone who has never seen one. Told that their upper trapezius measures 340, a patient has no way to know whether that is good, bad, or unremarkable.
The same number next to their own baseline of 410 becomes readable in one step. The unit no longer needs explaining, because the patient is reading a direction rather than a value.
| What you are showing | Best format | Why |
|---|---|---|
| One site, one visit | Spoken number plus context | A chart adds nothing to a single value |
| One site, baseline vs today | Two numbers side by side | Direction is visible without a graph |
| Several sites, one visit | Simple table or map | Shows where the finding is concentrated |
| Several sites over weeks | Trend visualization | Tables get hard to read as points accumulate |
| Full dataset | Chart documentation only | Needed for the record, not the conversation |
Should you compare the reading to normal values or to the patient's baseline?
Their own baseline, in almost every patient conversation. Stiffness varies sharply by anatomical location. A 2026 multi-point mapping study in Scientific Reports developed a 38-point protocol for the lower limbs and found statistically significant stiffness differences between consecutive measurement points, with values spanning roughly 137 to 1,118 newtons per meter across the mapped sites.
If adjacent points on the same limb differ that much, telling a patient their reading is above or below a population average may suggest more than the data supports. Their previous reading is the comparison you actually controlled.
Survey data: In a 2026 survey of 455 patients who stopped chiropractic care, 58% cited perception-based reasons: 36% felt no progress, and 22% felt better and stopped. Neither group was told their stiffness was still elevated.
What do you do with a reading that moved the wrong way?
Show it. A practice that only presents favorable numbers is not running a measurement program, it is running a highlight reel, and patients read that quickly. The credibility of every good reading depends on the patient believing you would have shown a bad one.
There is also a clinical use for it. A reading that rose while the patient reports feeling better is a real finding, and it is exactly the situation where the 22% who self-discharge tend to walk out.
Does the patient hear "stiffness" the way you mean it?
Not reliably. Qualitative work in BMC Musculoskeletal Disorders found that patients describe stiffness as restriction or tightness, distinct from pain, which they describe as sharper and more limiting to activity.
So a patient shown an improving stiffness reading may hear a promise about how their back will feel. Saying that the reading tracks a mechanical tissue property and may not move in step with symptoms costs one sentence and prevents the misreading.
Frequently Asked Questions
Should you show a chiropractic patient raw stiffness numbers or a simplified report?
It depends on how much data you are showing. Research on presenting clinical test results found that a plain table was sufficient for simple result sets, while trend visualizations worked better for complex long-term data. A single baseline reading fits in a sentence. Six sites tracked over eight weeks needs a visual.
Does the format of a clinical result actually change what people conclude?
Yes. In a 2013 crossover experiment published in the Journal of the American Medical Informatics Association, the same laboratory data presented four different ways produced different assessments of trend, overall level, and covariation. The authors concluded that no single visualization was ideal across all settings.
Will raw stiffness numbers confuse a patient?
A number without a reference point usually will. A stiffness reading in newtons per meter means nothing on its own. It becomes interpretable when the patient sees it next to their own baseline, which converts an unfamiliar unit into a direction of change.
Should you compare a patient's stiffness reading to normative values or to their own baseline?
Their own baseline is the safer comparison for patient conversations. Stiffness values vary substantially by anatomical site, and a 2026 multi-point mapping study in Scientific Reports found significant differences between adjacent measurement points in the lower limbs. Comparing a patient to a population average invites overinterpretation.
How much detail should a progress report contain?
Enough to show direction and enough to survive a skeptical question. Most patients need one comparison and one sentence of interpretation. The full dataset should exist in the chart in case the patient, another provider, or a payer asks for it.
Should you hide a stiffness reading that got worse?
No. Showing only favorable readings turns the measurement into marketing, and patients notice when data appears selectively. A reading that moved the wrong way is a clinical finding worth discussing, and discussing it openly is what makes the favorable readings credible.
Do patients understand stiffness the same way clinicians do?
Not exactly. Qualitative research in BMC Musculoskeletal Disorders found that patients describe stiffness as restriction or tightness and pain as sharper and more activity-limiting. When you present a stiffness reading, the patient may map it onto a sensation you did not measure.
One approach is to add a second channel of objective data alongside subjective pain reports. Options include soft tissue stiffness measurement (such as MuscleMap), range-of-motion testing, and posture analysis. Each gives you something concrete to show the patient rather than asking them to take your word for it.