
One point is enough to track a patient over time, but only if you return to the exact same point every visit. A 2026 mapping study recorded stiffness values from roughly 137 N/m to 1,118 N/m across 38 sites on the lower limbs, with significant differences between neighbouring points. Where you place the probe can matter more than who you are measuring.
How much does stiffness vary within one muscle?
Enough that site choice can swamp the effect you are trying to observe. The 2026 multipoint mapping protocol published in Scientific Reports assessed 38 defined points across the anterior, lateral, posterior and inferior compartments of both lower limbs in healthy adults. It found statistically significant differences between consecutive points, with large effect sizes, and a directional pattern in which stiffness rose progressively toward the distal and lateral parts of the limb.
Read that against what you are usually looking for. A meaningful change in a patient over six weeks is a modest shift in one number. If moving the probe two centimetres can produce a difference of similar size or larger, then sloppy landmarking does not add noise to your trend. It replaces it.
So do you need one point or many?
It depends on which question you are asking, and the two questions are not interchangeable.
| Question you are asking | Points needed | What matters most | Chair time |
|---|---|---|---|
| Has this patient changed since baseline? | One marked site per muscle | Returning to the identical landmark | Low |
| Is the left side different from the right? | One matched site per side | Mirror-image landmarking | Low |
| Where in this region is stiffness concentrated? | Several points across the region | A fixed, repeatable grid | Moderate |
| What is normal for this muscle in general? | Research-grade mapping | Large, diverse samples | Not a clinic task |
Most chairside use is the first row. You are not trying to characterise the muscle. You are trying to answer whether this patient's reading at this site has moved. That takes one point, marked properly, repeated.
What actually breaks repeatability?
Landmark drift, patient position, and measuring at the wrong moment. Reliability is a property of the protocol rather than the device. A 2024 systematic review of MyotonPRO reliability reported intraclass correlation coefficients commonly between 0.75 and 0.95 across muscle groups, which is strong. Those numbers come from studies that controlled position and site tightly. A clinic that eyeballs the spot each visit is not running the protocol those numbers describe.
Three habits carry most of the benefit. Define the site by distance from a bony landmark and write it in the note. Use the same patient position every time. Measure before manual work rather than after, so the tissue has not just been handled.
Survey data: In a 2026 survey of 455 patients who stopped chiropractic care, 58% cited perception-based reasons: 36% felt no progress, and 22% felt better and stopped. Neither group was shown that their soft tissue stiffness was still elevated.
Should you compare the reading to published norms?
Use the patient's own baseline first. Reference value work is still early. The 2025 reference values pilot in the Journal of Manual and Manipulative Therapy established preliminary resting stiffness and asymmetry values in healthy young adults and found sex to be the primary predictor, while calling for larger and more diverse samples before clinical reference intervals are settled. A population average from a narrow sample is a weak comparator next to the same patient measured at the same site six weeks earlier.
Keep the interpretation narrow either way. A reading that sits above a patient's baseline may reflect a difference in the tissue. It does not diagnose a condition and it does not predict symptoms, because stiffness and pain move independently. Its value is that it is a number the patient can see, which is a different kind of evidence than asking them how they feel.
Frequently Asked Questions
How many points should you measure per muscle?
One well-marked mid-belly point is enough for tracking a single patient over time, as long as you return to that exact point every visit. If you want a picture of how stiffness is distributed across a region, you need several points, because adjacent sites differ significantly.
How much does stiffness vary across one muscle?
A lot. A 2026 mapping study of the lower limbs recorded stiffness values ranging from roughly 137 N/m to 1,118 N/m across 38 points, with statistically significant differences between consecutive points. Site choice can matter more than the patient.
Does moving the probe a couple of centimetres change the result?
It can. The 2026 mapping study found significant differences between neighbouring points, and stiffness rose progressively toward the distal and lateral parts of the limb. Landmark drift between visits is one of the most common sources of false change.
Should you average several readings at the same spot?
Yes. Taking a small set of repeat readings at one marked site and using the average reduces the influence of any single odd measurement. This is different from measuring multiple sites, which answers a different question.
How do you make sure you return to the same point next visit?
Define the site relative to a fixed bony landmark, not by eye. Record the landmark, the distance, and the patient position in your note, and repeat all three at re-examination.
Does more points mean a better reading?
More points give you better spatial resolution, not better accuracy at any one site. Extra points cost chair time, so add them only when the distribution of stiffness across a region is the thing you actually want to know.
Can you compare a patient's reading to published reference values?
Loosely. Reference value work is still early, and a 2025 pilot found sex was a primary predictor of resting stiffness. The patient's own baseline at the same site is a far stronger comparator than a population average.
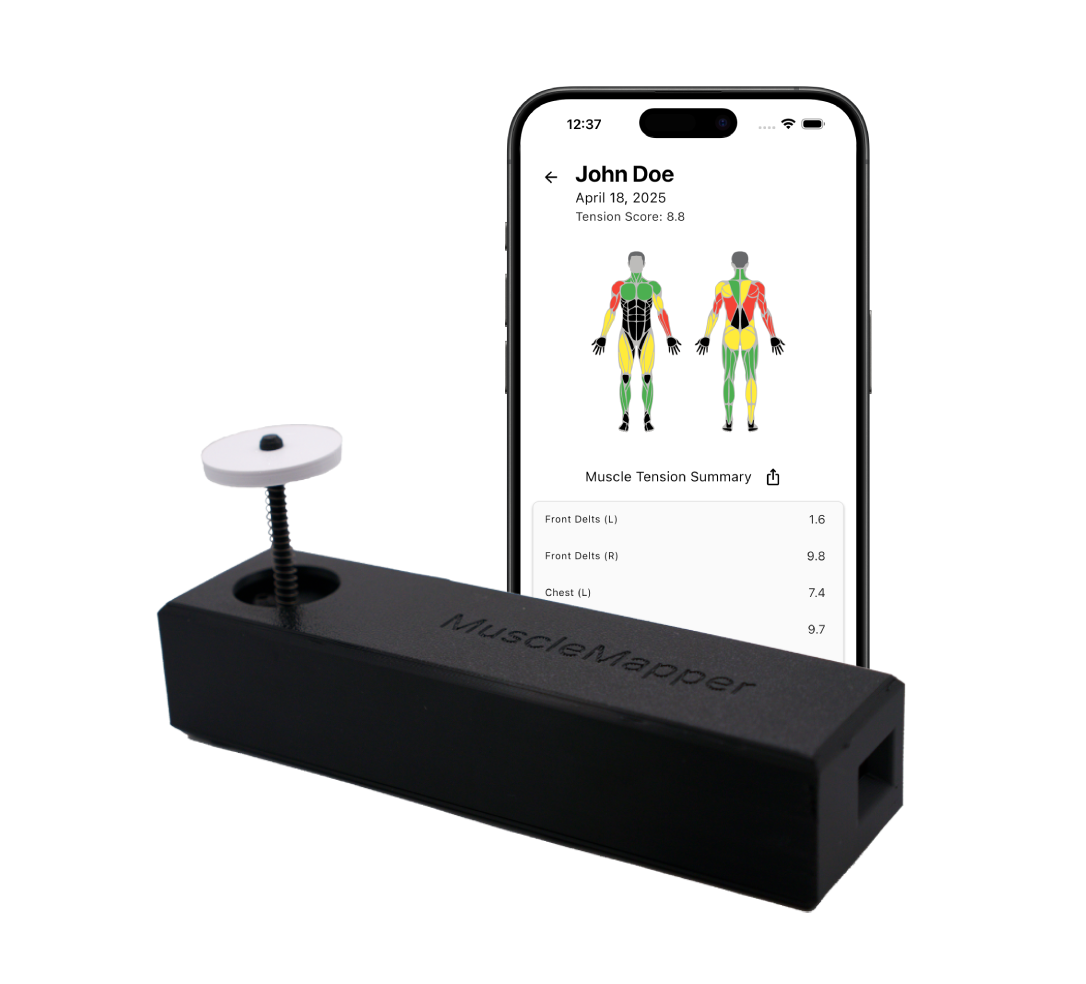
One approach is to add a second channel of objective data alongside subjective pain reports. Options include soft tissue stiffness measurement (such as MuscleMap), range-of-motion testing, and posture analysis. Each gives you something concrete to show the patient rather than asking them to take your word for it.