
The evidence suggests it may. A 2025 study in the European Spine Journal of 50 adults found that greater fat infiltration in the lumbar multifidus at L4/L5 was significantly associated with a higher measured stiffness ratio (p = 0.002). Composition of the tissue, not just its behaviour, appears to move the number.
What did the research actually find?
A positive association between fat inside the muscle and measured stiffness, at one spinal level. The study compared 25 people with chronic non-specific low back pain against 25 age-matched and sex-matched controls. Fat infiltration was assessed on MRI. Stiffness was assessed with shear wave elastography at L4/L5 and L5/S1, on both sides.
Two results are worth separating. Greater multifidus fat at L4/L5 tracked with a higher stiffness ratio. But fat infiltration showed no relationship with the muscle's thickness ratio from rest to submaximal contraction. The tissue looked different on a stiffness measure and behaved the same on a contraction measure.
That combination is the useful part. It suggests a stiffness reading in these patients may partly report what the muscle is made of rather than only what the muscle is doing.
How is intramuscular fat different from subcutaneous fat?
One sits between your sensor and the muscle. The other is inside the muscle you are measuring. They create different problems and need different responses.
| Subcutaneous fat | Intramuscular fat | |
|---|---|---|
| Where it sits | Between skin and muscle | Within the muscle tissue |
| Type of problem | Measurement obstacle | Change in what is being measured |
| Effect on the reading | May damp or blur the signal | May shift the value the tissue genuinely returns |
| How you assess it | Visible and palpable at the site | MRI, not a handheld device |
| Practical response | Choose sites with less overlying tissue | Interpret the absolute number more cautiously |
Both argue for the same discipline. Mark the site, use the same site every visit, and treat the patient's own first reading as the reference point.
Does this make the reading unreliable?
It makes the absolute number harder to interpret. It does not make the change over time less useful.
If a patient's composition contributes a fixed offset to their reading, that offset is present at baseline and present at re-examination. The difference between the two visits still reflects what shifted in between. A number you cannot compare to a population is still a number you can compare to the same patient four weeks ago.
The bigger interpretive risk is assuming readings only move in one direction. A 2025 diagnostic accuracy study in the European Spine Journal measured quadratus lumborum stiffness in 80 participants and found it was significantly lower in people with chronic non-specific low back pain than in controls. Even with a significant group difference, the measure separated individuals poorly. Stiffness is a signal to track, not a verdict to hand down.
Survey data: In a 2026 survey of 455 patients who stopped chiropractic care, 58% cited perception-based reasons: 36% felt no progress, and 22% felt better and stopped. Neither group was shown that their soft tissue stiffness was still elevated.
What should you change in practice?
Tighten the protocol and loosen the claim. Three specific changes cover most of it.
First, fix the site. A 2026 methodological pilot study in Scientific Reports mapped 38 measurement points across the lower limbs and found statistically significant stiffness variation between consecutive points. If the site drifts between visits, you are measuring different tissue and calling it change.
Second, compare the patient to themselves. Reference ranges are a weak comparison when composition varies between people and you cannot see that composition in the room.
Third, say what the number is and is not. A reading may reflect a mix of tissue composition and current tissue state. Telling a patient that plainly costs nothing and protects the credibility of every future reading you show them.
Frequently Asked Questions
Does fat inside the muscle affect stiffness readings?
The current evidence suggests it may. A 2025 study of 50 adults found that greater fat infiltration in the lumbar multifidus at L4/L5 was significantly associated with a higher shear wave elastography stiffness ratio. The association was found at one spinal level in one muscle, so it should not yet be generalised to every site.
Is intramuscular fat the same as subcutaneous fat for measurement purposes?
No, and the distinction matters. Subcutaneous fat sits between the sensor and the muscle and acts as a measurement obstacle. Intramuscular fat is part of the tissue being measured, so it may change the reading because the tissue itself has changed.
Does a higher stiffness reading in a patient with fatty infiltration mean the muscle is working harder?
Not necessarily. In the same 2025 study, fat infiltration was not related to the muscle's thickness ratio from rest to contraction, which is a measure of how much the muscle changes when it activates. A higher stiffness reading may reflect composition rather than effort.
Should you stop measuring stiffness in patients with suspected fatty infiltration?
No. A reading that partly reflects tissue composition is still a reading you can repeat. What changes is the interpretation of the absolute number, not the value of tracking that number over time in the same patient.
Can you tell from a stiffness reading alone whether fat infiltration is present?
No. Fat infiltration is assessed on MRI, not with a handheld device. An association across a group does not let you work backwards from one patient's number to their tissue composition.
Do stiffness readings always go up in patients with low back pain?
No, and assuming they do is a common error. A 2025 diagnostic accuracy study of 80 participants found quadratus lumborum stiffness was significantly lower in people with chronic non-specific low back pain than in controls, and the measure still separated the groups poorly.
Does fat infiltration make it pointless to compare a patient to reference values?
It weakens the comparison without erasing it. Reference values are a rough sanity check at best, and the patient's own baseline is the more defensible comparison in almost every clinical situation.
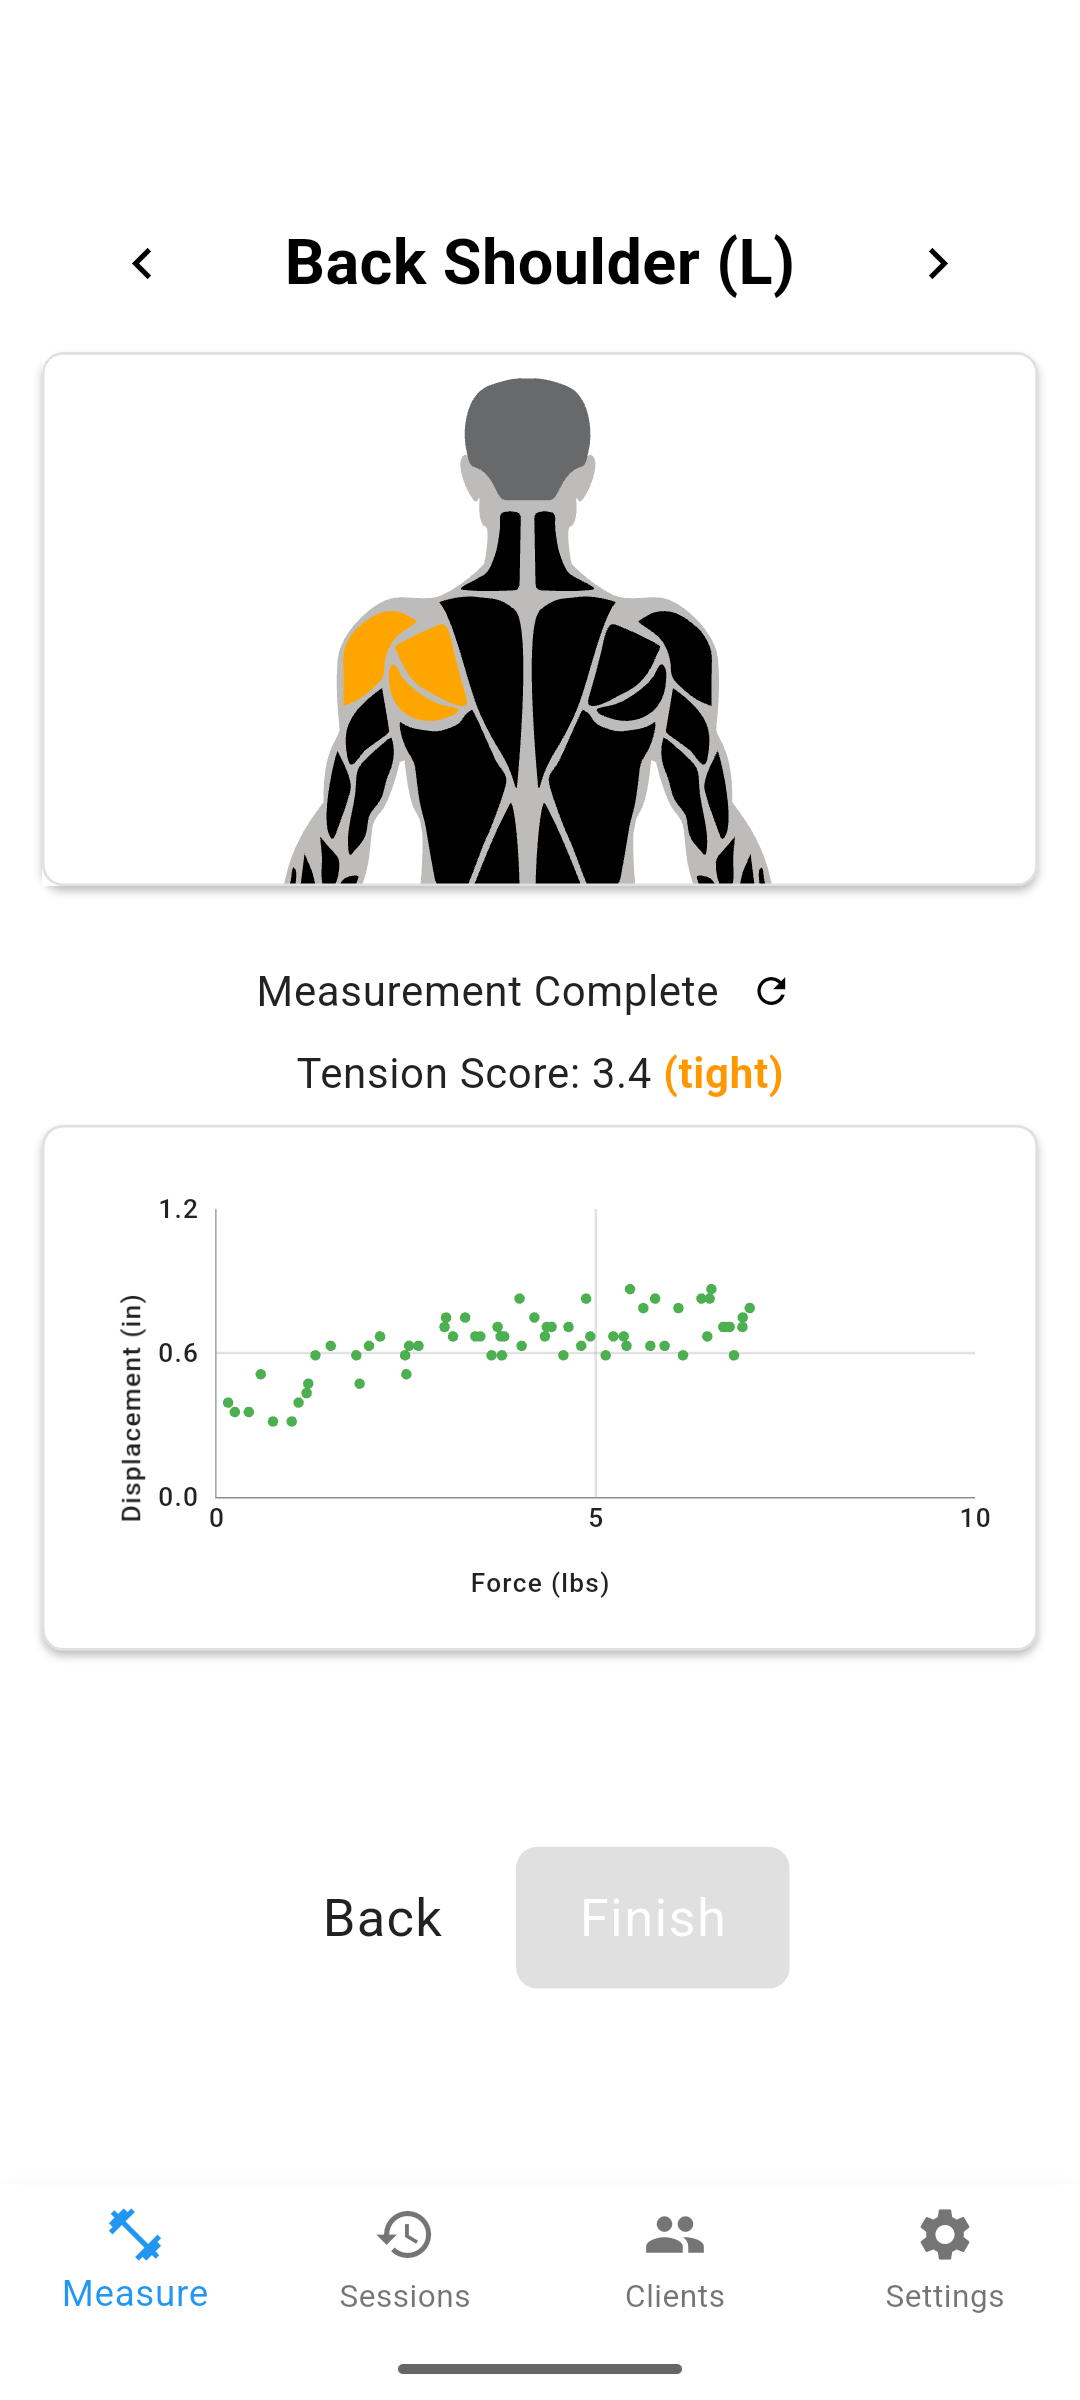
One approach is to add a second channel of objective data alongside subjective pain reports. Options include soft tissue stiffness measurement (such as MuscleMap), range-of-motion testing, and posture analysis. Each gives you something concrete to show the patient rather than asking them to take your word for it.